It is no secret that every scientific, engineering, or analytical discipline has its own specialized computing needs. In fact, many of these disciplines have developed entirely separate sets of tools for working with data, covering data storage, reading, processing, plotting, analysis, modeling, and exploration.
Unfortunately, most of these existing stacks are based on outdated architectures and assumptions:
- Not cloud or remote-friendly: Often tied to a local GUI or a desktop-only operating system
- Not scalable: Code runs only on a single CPU, whether that is for technical reasons or due to licensing issues, and assumes data is available locally
- Not general purpose: Tied to rigid assumptions about data content, which limits innovation and collaboration, and also limits the audience, maintainer community, and potential funding sources
It is time for a better way, and the Python community has created it!
What is Pandata? (And Why You Need It)
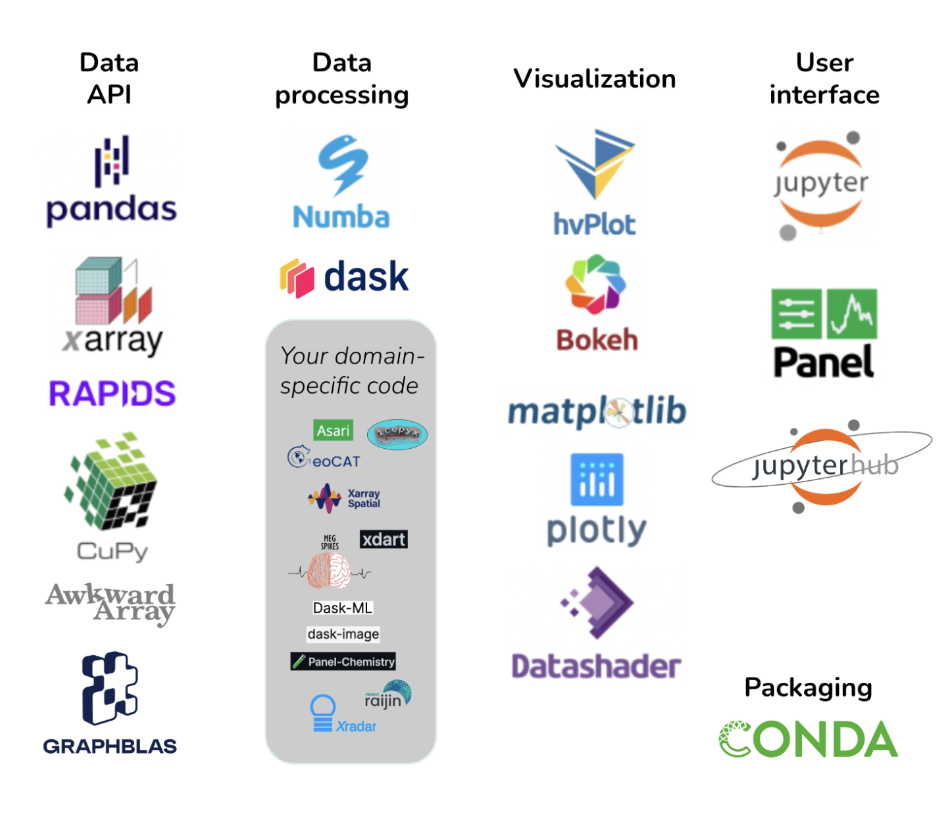
Pandata is a collection of open-source Python libraries that can be used individually and are maintained separately by different people, but that work well together to solve big problems. You can use the Pandata website to identify which of the thousands of available Python libraries meet Pandata standards for scalability, interactivity, cloud support, and so on. Pandata includes Parquet and Zarr data formats, the Pandas, Xarray, and Rapids data APIs, the Numba and Dask high-performance computing tools, the hvPlot, Bokeh, Matplotlib, and Datashader visualization tools, the Jupyter and Panel user interface tools, and many more!
12 Reasons to Use Pandata
Pandata is a scalable open-source analysis stack that can be used in any domain. Instead of using tools specific to your domain, you can use modern Python data science tools that are:
- Domain independent: Globally used, maintained, and tested by many community members, and funded from many different sources
- Efficient: Utilize vectorized data or JIT compilation to run at machine-code speeds
- Scalable: Run on anything from a single-core laptop to a thousand-node cluster with petabytes of data
- Cloud-friendly: Use any file storage system, with local, clustered, or remote compute
- Multi-architecture: Run on Mac/Windows/Linux CPUs and GPUs the same on your desktop or on a remote server
- Scriptable: Run in batch mode for parameter searches and unattended operations
- Compositional: To solve your problem, select the tools you need and put them together
- Visualizable: Render even the largest datasets without conversion or approximation
- Interactive: Support fully interactive exploration, not just rendering static images or text files
- Shareable: Deployable as web apps for use anywhere by anyone
- Open-source software (OSS): Free, open, and ready for research or commercial use, without restrictive licensing or limitations on sharing and reuse
Note that many Pandata tools are commonly used in the field of data science, not any particular scientific or research domain. You may not think you are doing data science, but data science tools are simply ways of working with data that are applicable across many disciplines! Data science isn’t just for artificial intelligence (AI), machine learning (ML), and statistics, although it supports these areas well, too.
Who Runs Pandata?
There are no management, policies, or software development associated specifically with Pandata; it is simply an informational website in GitHub set up by the authors of some of the Pandata tools. Check out the website, consider using the tools, and if they meet your needs, use them with the confidence that they will generally work well together to solve problems. Feel free to open an issue about what to do with Pandata if you have any questions or ideas.
Examples
There are lots of examples online of applying Pandata libraries to solve problems, including:
- Pangeo: JupyterHub, Dask, Xarray for climate science; Pandata is Pangeo but for any field
- Project Pythia: Geoscience-specific examples, many of which use Pandata tools
- Attractors: Processing huge datasets with Numba, rendering with Datashader
- Census: Reading chunked data from Parquet, rendering with Dask + Datashader
- Ship traffic: Rendering spatially indexed data with interactive lookup
- Landsat: Intake data catalog, xarray n-D data, hvPlot+Bokeh plotting, Dask ML
- Minian: Jupyter, Dask, and HoloViews for neuroscience
You can download and use any Pandata package in any combination and enjoy having all this power at your fingertips. See the Pandata paper from SciPy 2023 for more information.


 (17)")